
BatCave Monitor
A local desktop app that shows which processes are slowing your machine down and why
- Status
- v0.2.0 released
- Runs on
- Windows x64, Linux x64, and Apple Silicon macOS
- Built with
- Rust, Tauri, and Svelte
- License
- MIT
Overview
What it is
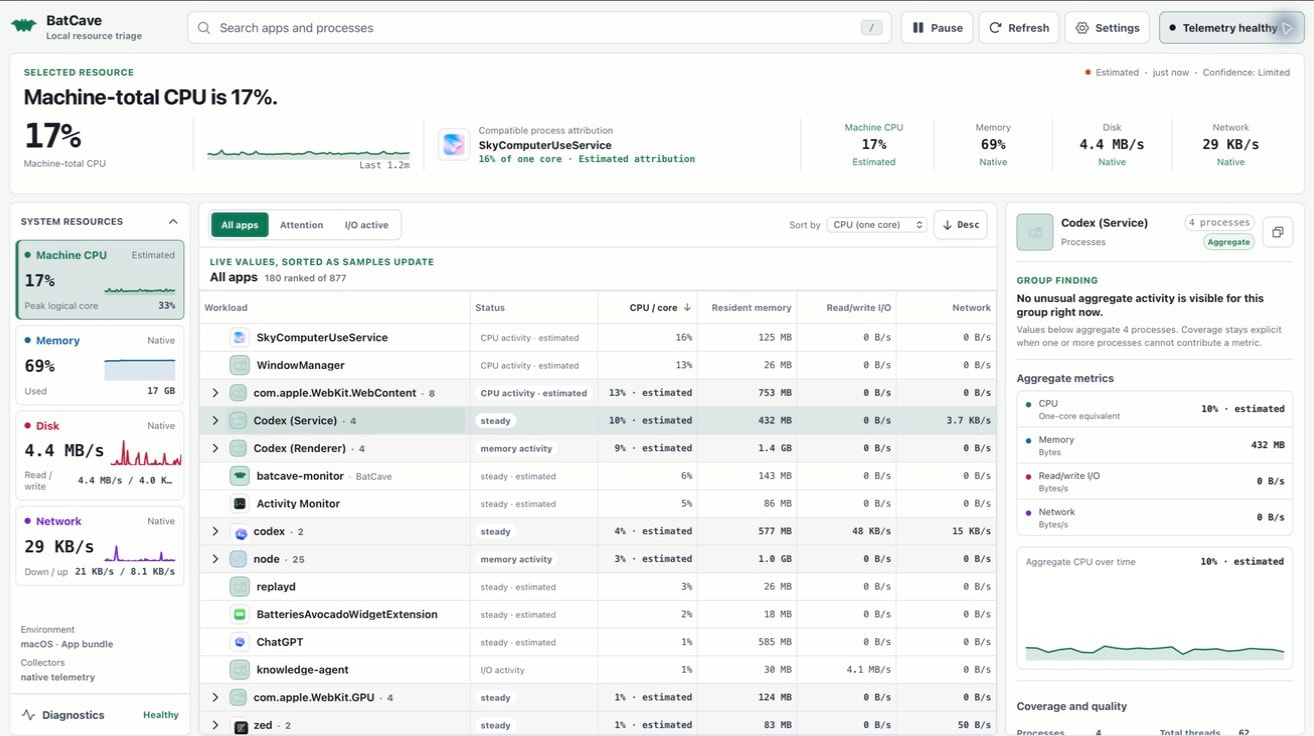
BatCave Monitor is a local desktop app for the moment a computer feels slow and the usual graphs still leave you guessing.
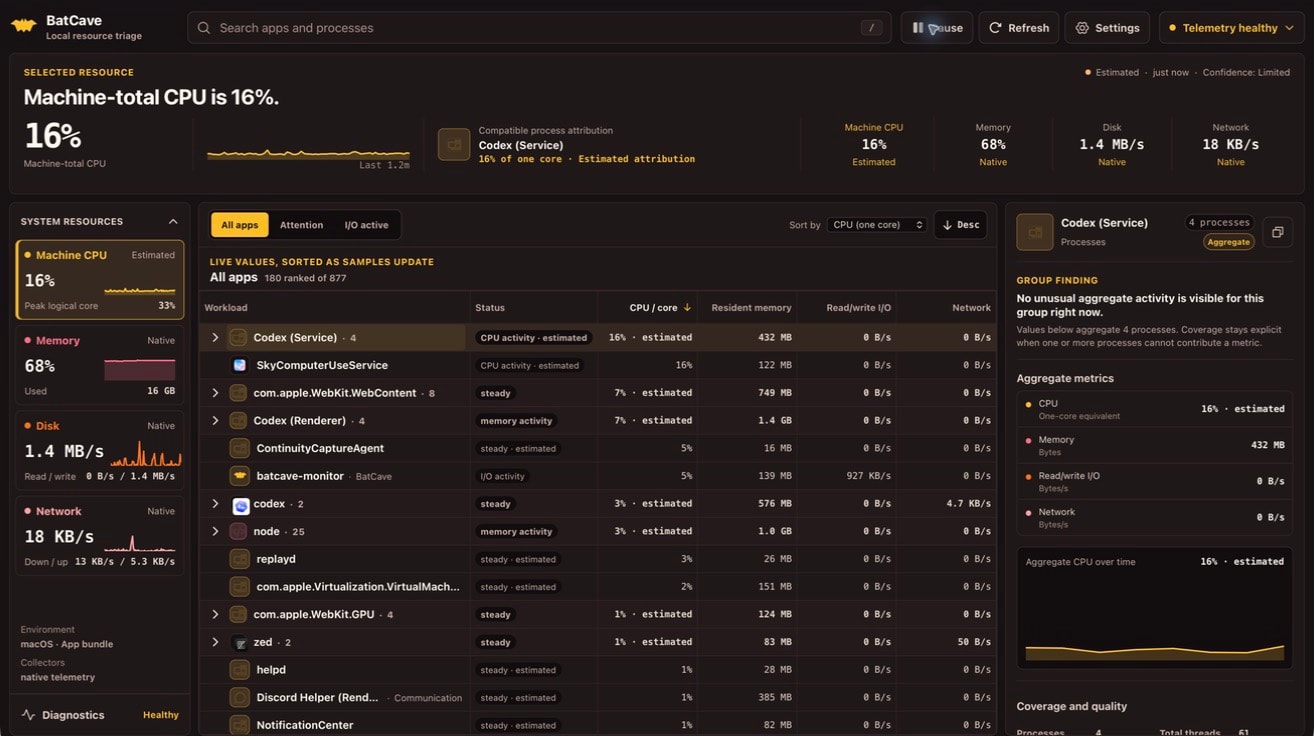
It puts machine-wide CPU, memory, disk, and network pressure beside a live ranking of grouped apps and individual processes. Select a resource or workload and the inspector opens the trends, totals, coverage, source quality, and technical details behind the finding.
The stable v0.2.0 release has downloads for Windows x64, Linux x64, and Apple Silicon macOS. The macOS app is signed and notarized. Windows downloads are unsigned.
Capabilities
What it does
- 01
Connects pressure to a workload
Puts machine-wide CPU, memory, disk, and network pressure beside the workload most likely to be responsible.
- 02
Ranks real workloads
Groups related processes, ranks them by CPU, memory, disk, or network activity, and filters the list to attention or I/O-heavy work.
- 03
Opens the evidence
Opens resource, process, and group views with trends, totals, coverage, source quality, and technical details.
- 04
Makes uncertainty visible
Labels readings as native, estimated, limited, held, pending, or unavailable instead of turning missing telemetry into zero.
- 05
Treats network as a first-class signal
Attributes process network activity through NStat on macOS, ETW on Windows, and optional eBPF probes on Linux.
- 06
Feels native and stays local
Offers Cave, Aurora, Ember, and Daylight palettes plus sampling and history controls, while keeping settings, cache, logs, and measurements on the machine.
Under the hood
Engineering decisions
- Hardest constraint
Give one interface three different operating systems
Windows, Linux, and macOS expose different telemetry with different failure modes. The shared model preserves those differences—including whether a reading is native, estimated, partial, held, or unavailable—so the interface never implies coverage a platform cannot provide.
- Design decision
Treat missing data as evidence
BatCave never turns a blocked or missing reading into zero. That costs protocol and interface complexity, but it keeps an unavailable process metric from looking like a healthy machine.
- Verification
Test the collector and the running app
The project tests collector contracts, quality-state propagation, workload grouping, and interface behavior separately. Native runtime checks then confirm that real workloads produce advancing telemetry; package checks remain a separate release gate.
Project links